
The ocean held the rising Carmel River at bay for awhile this morning, raising the lagoon to “action level,” but the river eventually prevailed and lagoon levels dropped.
When the Carmel and Big Sur Rivers flirted with flood stage last month, it passed largely without notice. They had not been projected to rise that high and so flood alerts weren’t issued.
This time, National Weather Service projections did call for peak flows near flood stage, so alerts went out, got amplified on social media, and pretty soon a lot of people were worried. As it turned out, local rivers all peaked below the high water marks set last month, and even further below the levels seen following the Soberanes Fire, in 2017.
The Big Sur River peaked at around 1,900 cubic feet per second (cfs) early this afternoon; nowhere near the 2,500 cfs it reached on January 17. To put this in perspective, the Big Sur River hit 7,650 on January 12, 2017, and its highest recorded flow was 10,700 cfs, in January 1978, following the Marble-Cone Fire.
In spite of Mining Ridge, the back side of which is in the Arroyo Seco watershed, receiving more than 8 inches of rain in a 24 hour period, the Arroyo Seco River peaked at only around 12,000 cfs this morning. It reached about 15,000 cfs in January.
The San Antonio River peaked at over 4,000 cfs, well short of its January flow of more than 7,000 cfs.
The Nacimiento River peaked at nearly 10,000 cfs; less than half its 20,000+ cfs flow in January.
The only river to come close to matching its January height was the Carmel River, which hit 9.11 inches on the gauge at Rosie’s Bridge (in the Carmel Valley Village) in January, and came within an inch or so of that peak again today. So why did the Carmel River respond so much more strongly to this week’s rains?
Well, maybe it didn’t. The peak flow in January was around 8,000 cfs, but when the USGS showed up to measure the flow in person near the peak today they found that what was actually flowing under Rosie’s Bridge was closer to 5,000 cfs.
Rivers are dynamic and constantly changing, which is why USGS frequently takes on-the-spot flow measurements during high water events. This allows them to recalibrate the “rating curves” that determine how many cubic feet per second correspond to varying water levels at the gauging stations.
This significant reduction in flow, in spite of similar levels on the gauge, suggests that the channel capacity at the Rosie’s Bridge gauge has decreased – probably as a result of a pulse of gravel or sand raising the river bed.
This underscores how difficult it is to predict flood risk based on gauge height determined “flood stage.” Right now the Carmel River can hit its official flood stage by reaching 9 feet at Rosie’s Bridge, even though the amount of water actually in the river is much less than has been the case when 9 feet has been reached there in the past. But as the pulse of sand or gravel raising the height of the river at Rosie’s moves downstream, it could conceivably constrict the channel somewhere else enough to send the river over its banks when the gauge is far lower than 9 feet.
The bottom line is that if you live near a stream or river you should ALWAYS keep alert during major rain events. The warning systems are helpful, but they’re far from perfect. Whenever water is high, streams in broad valleys can breach their banks and change course within minutes. What constitutes “flood stage” or a dangerous rate of flow is a constantly moving target.
The good news is that, thanks to these storms, Lake San Antonio is now at over 25% capacity and Lake Nacimiento is over 50% full.
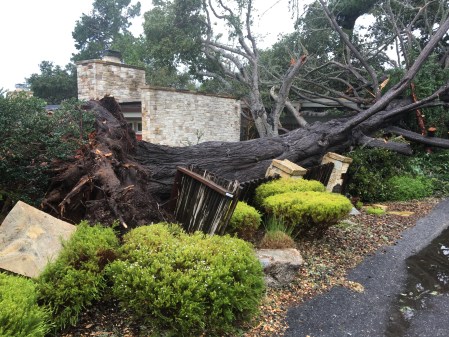
Saturated soil + heavy wind =

Well written, and good information. Thank you!
The NOAA website for river flows shows a maximum height at Rosie’s at 8.7 ft , not 9.1 ft as reported in the media. Not sure where the latter number came from. Sure interesting about the CT’s!
Sent from my iPhone
>
I’m not sure what yesterday’s exact peak was, but the USGS gauge readout clearly shows it slightly exceeding 9 feet, as can be viewed at https://waterdata.usgs.gov/nwis/uv?11143200.
Years ago, we asked the Chief of the Orange County Flood Control District about flood calcs and warnings. This was after a high water event where some communities were flooded and/or “islanded” by overflows. We queried him about how the District evaluated its model for flooding events, to which he responded, “we just recalculate the model.” Kinda like TV weather forecasters!
Please note that OC waterways are mostly concrete channels, so sediment transport is much less of a factor compared to the Carmel River or natural channel streams.